Read part 1 here
Introduction
The primary goals of the Bank of Ghana are to pursue general price level stability and support the general economic policies of the Government of Ghana to promote economic growth and development. This article examines the trends in historical inflation and unemployment rates in Ghana, Guinea, and Malaysia. We also briefly comment on the existence or otherwise of the so-called Phillips Curve.
Inflation
Inflation is the general appreciable increase in prices of goods and services or the decrease in the purchasing power of the standard unit of currency. It is one of the most crucial economic indicators which directly affects the living standard of citizens. Depending on the question of interest, there are many indices designed to measure different aspects of inflation, the Consumer Price Index (CPI) and the Producer Price index (PPI) being the most common. We examine historical inflation rates in Ghana as measured by changes in the CPI since attaining political independence in 1957 (subject to data availability) relative to Malaysia and Guinea who also became politically independent around the same time as Ghana.
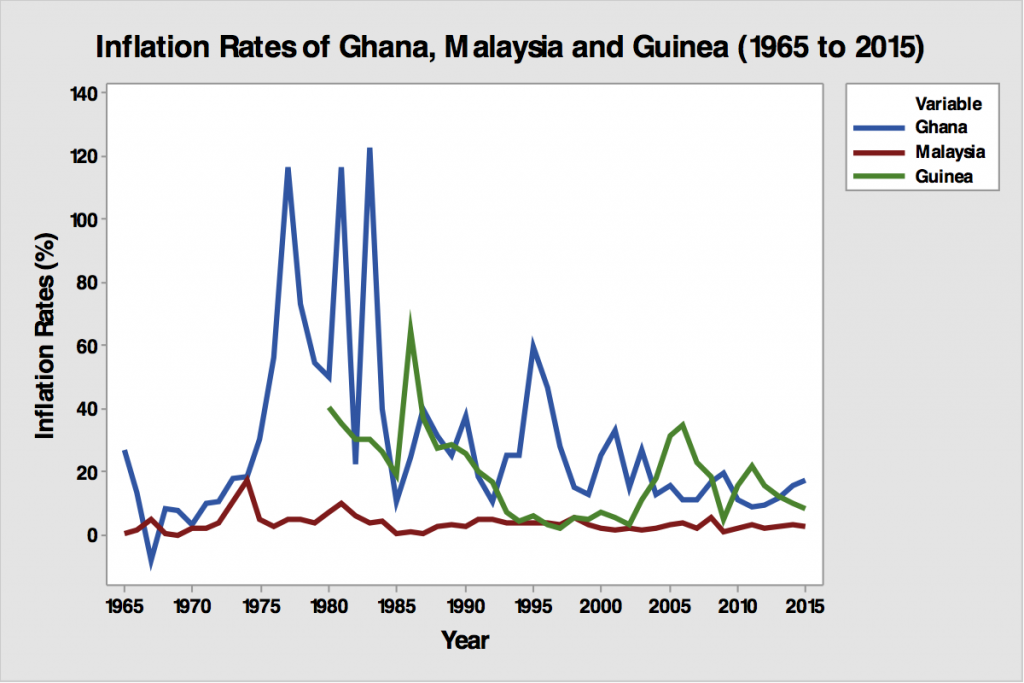
As shown in Figure 1, Ghana’s inflation rate has not been stable, ranging from -8.4% (1965) to 122.8% (1983). The inflation rate peaked in 1983 when Ghana experienced arguably the worst economic crisis in her modern history. Although the detrimental effects of high inflationary pressures are well-documented, single digit inflation has eluded several previous governments until 2011 and 2012 fiscal years when Ghana recorded inflation between 8-9%. However, this feat was short-lived and inflation rates have increased thereafter to about 17% in 2015.
Malaysia’s experience is quite different. As depicted in Figure 1, Malaysia has enjoyed relatively low inflation rates since 1965, reaching a high of only 17.3% in 1974. Although a detailed examination of how Malaysia maintained such remarkably low rates of inflation over the past five decades is beyond the scope of this article, one can reasonably assume that this is the outcome of the pursuit of sound monetary policies.
Compared to Guinea (where data are only available from 1980), Ghana has relatively higher inflation rates except between 2005 and 2013. Overall, Ghana’s performance in taming inflationary pressures is less than desirable in light of the fact that the societal costs of expected and unexpected inflation are catalogued in any standard introductory economics textbook: shoe leather costs, menu costs, inefficient allocation of resources, arbitrary redistribution of wealth among individuals, and the general discomfort of living in a world with ever-changing prices.
Unemployment Rate
The unemployment rate is generally defined as the percentage of the labor force that is currently not employed but actively seeking employment. The International Labor Organization defines an unemployed person as someone actively looking for job but has not found one. The unemployment rate is one of the significant indicators of a country’s general economic well-being. An unemployed person has no direct sources of income and in many cases may have to depend on the Government, family, and friends for basic needs such as food and shelter.
Since gaining political independence, how has Ghana fared in achieving maximum employment for her citizenry? Let’s see what the available data tells us. Note that due to data availability challenges with the unemployment rate, our comments are limited to the available data, assuming the data capture rate is relatively accurate and uniform across all the three countries.
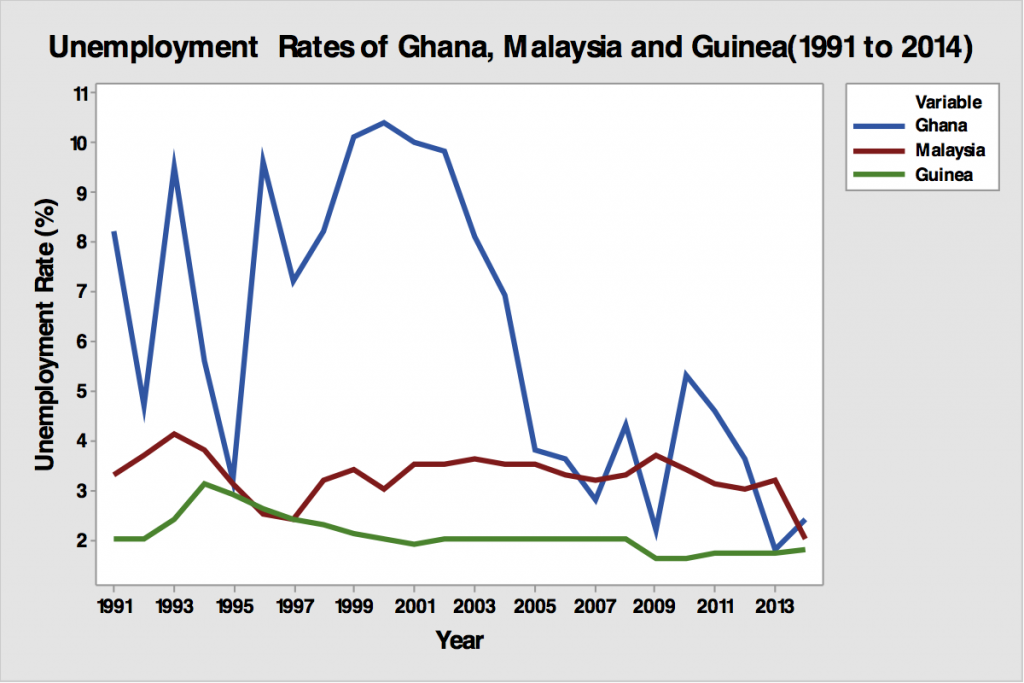
As shown in Figure 2, Ghana’s unemployment rate is generally the highest among the three countries, ranging from 1.8% in 2013 to 10.4% in 2000. Guinea’s unemployment rate is relatively stable around 2% while Malaysia’s unemployment rate is sandwiched between those of Ghana and Guinea. Figure 2 also suggests that there is always some level of unemployment in these economies (and any economy for that matter), supposedly due to frictional unemployment that is inevitable in any continuously changing economy.
Ghana has the most erratic unemployment rate among the three countries, suggesting yet another area where Ghana can do better. Notably, there are important challenges in measuring unemployment, some of which may be more pronounced in developing countries in sub-Saharan Africa. The data shows that only less than 10% of Ghanaians were unemployed over the period under consideration. However, it is not uncommon to come across reports in the news media that paint a much worse picture of the unemployment situation than these data show. These reports are typically fueled by complaints by individuals about their personal struggles as well as political pundits during radio and TV talk shows. This puzzle may be due to low data capture rate especially in the rural areas as well as the challenges of defining unemployment that suits the peculiar economic environment in developing countries. For instance, individuals who are under-employed (i.e., who are actually working and hence not counted as unemployed) but earn so little that they are practically unable to meet their basic necessities may consider themselves unemployed. Also, further segmentation of the data by key demographic attributes such as age, gender or geographical attributes may reveal interesting insights and unemployment patterns. For instance, unemployment among college graduates may be expected to be higher than the overall unemployment rate. Nonetheless, Ghana can do more to create jobs for her citizens and/or empower them to be gainfully employed.
The Phillips Curve: The Cases of Ghana, Guinea, and Malaysia
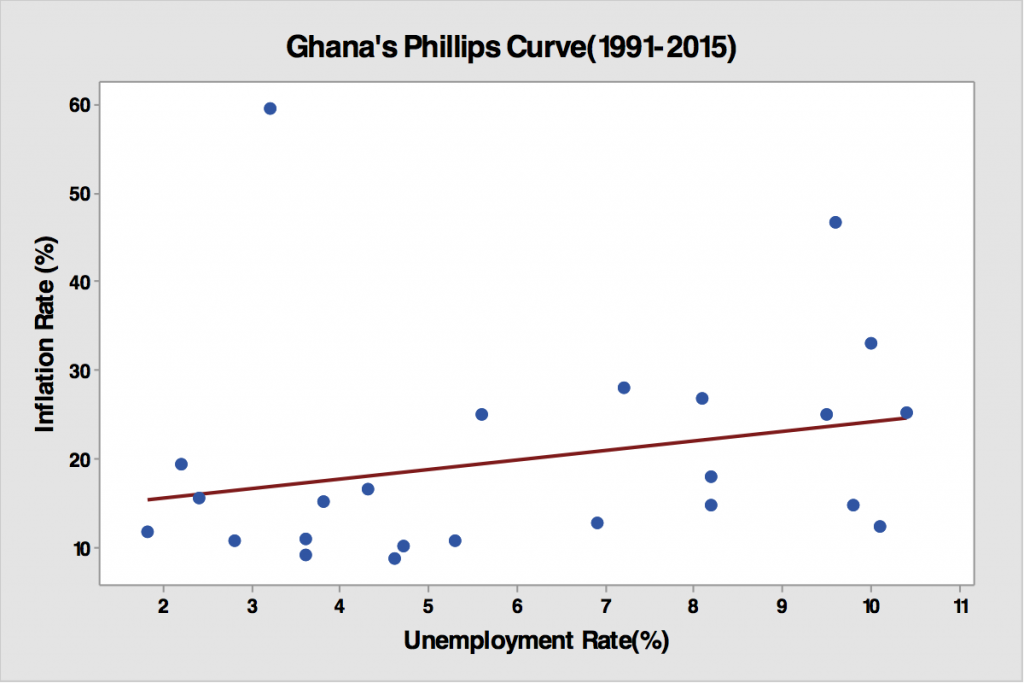
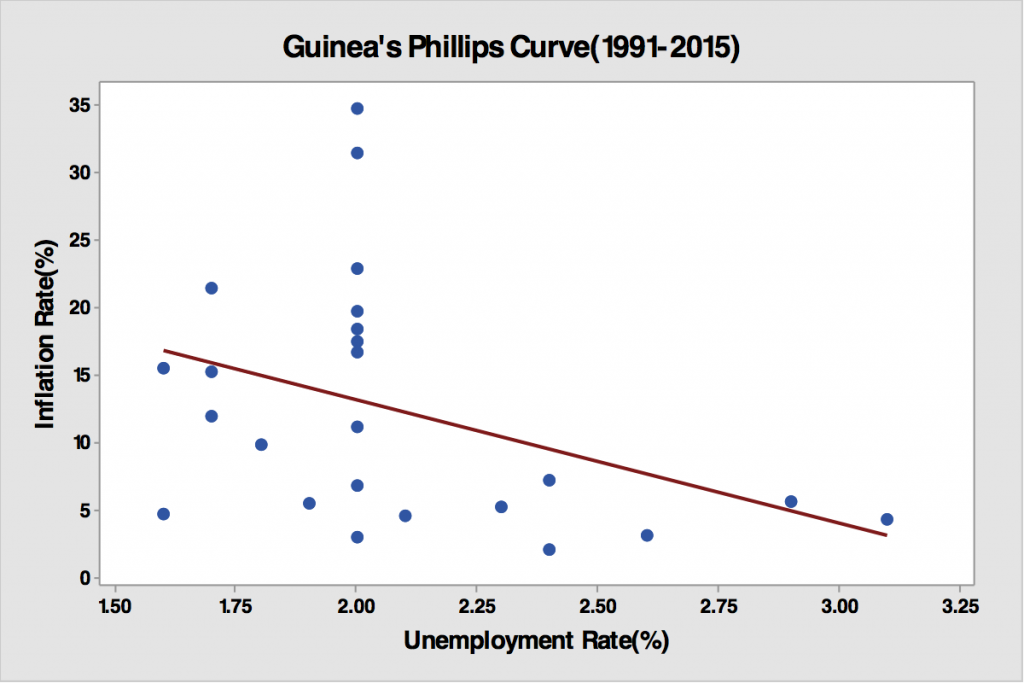
Because inflation and unemployment are such important macroeconomic indicators, their statistical relationship is often represented by the Phillips Curve. The modern Phillips curve posits a negative relationship between inflation and unemployment. We do not set for ourselves the ambitious task of rigorously investigating whether a structural relationship actually exists between inflation and unemployment that may be exploited by policymakers; we merely provide descriptive graphical evidence of the Phillips curve in the countries under consideration.
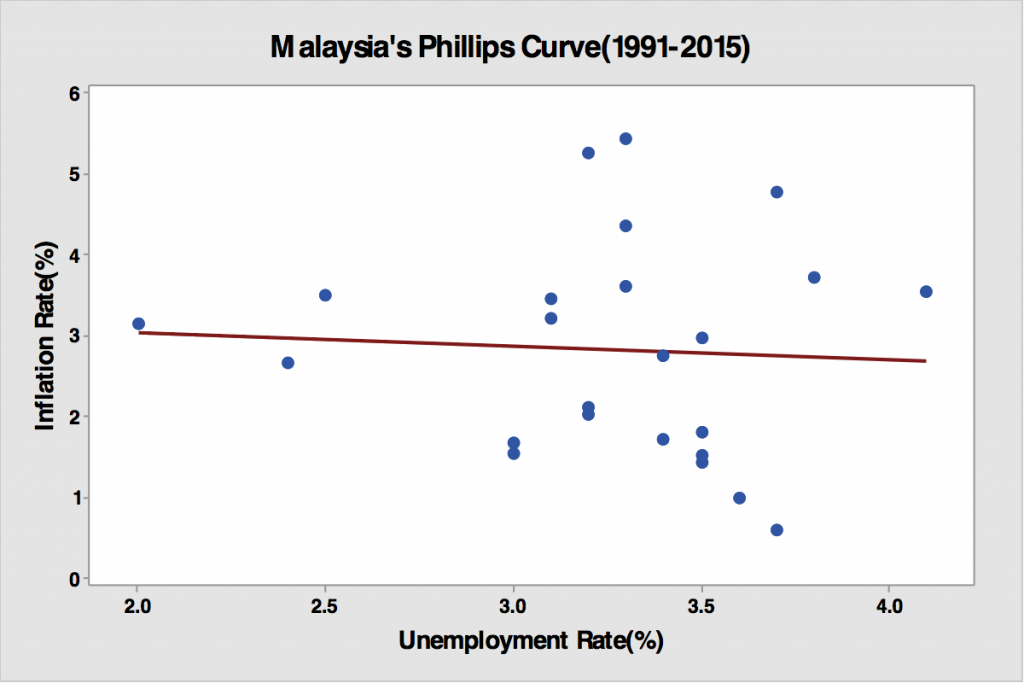
In all three countries, the existence of the Phillips curve is not obvious under the time period we considered. As evidenced in Figure 3, there appears to be a positive relationship between inflation and unemployment rates in Ghana while the relationship is seemingly weakly negative in Guinea and Malaysia. This is not surprising because empirical evidence for the Phillips curve depends on the country and time period under study. Even when it has been found to exist, it is not clear that the Phillips curve represents a causal relationship that can be exploited by policymakers. The key question of whether any observed statistical relationship between inflation and unemployment can be exploited in the short run by policy makers remains a subject of ongoing research by economists.
Concluding Remarks
This is the second piece in a two-part Wave2 Analytics series that considered several macroeconomic time series indicators of a nation’s economic well-being: GDP per capita, GDP growth rate, Debt-to-GDP ratio, inflation and unemployment. We do not claim that this list is either exhaustive or that our analysis is without limitations. However, we believe that is it instructive to dig into the data and uncover patterns and relationships that are interesting and can spark further research and interrogation.
Here is the resounding theme in our examination of the data: Ghana can do better! Whether it is in the realm of monetary tools that can be harnessed to control inflation or governments creating more economic opportunities through strengthening democratic institutions and investing in the country’s human and physical capital, Ghana is far from reaching her economic paradise.
We hope that by creating awareness of these deep economic issues facing the Ghanaian economy through data exploration and comparative analysis, we can engender greater interest in research (and data science) that would generate informed ideas to transform our Motherland.
Long Live Ghana!
source of data and how does this analysis help the country in general?